


Nulastin CRO Case Study
Increasing Subscriber LTV Through Segmented CRO on Shopify
Platforms and Integrations:
See all our Partners


This case study documents how we partnered with a subscription-focused Shopify brand to increase active subscribers, improve retention behavior, and grow long-term revenue through a structured conversion rate optimization (CRO) program.
Rather than optimizing for short-term metrics alone, we focused on improving subscriber quality and lifetime value, using metrics such as Revenue per Visitor (RPV) and first-time subscription conversion as leading indicators of long-term impact.
- UIUX Design & Strategy
- Conversion Rate Optimization
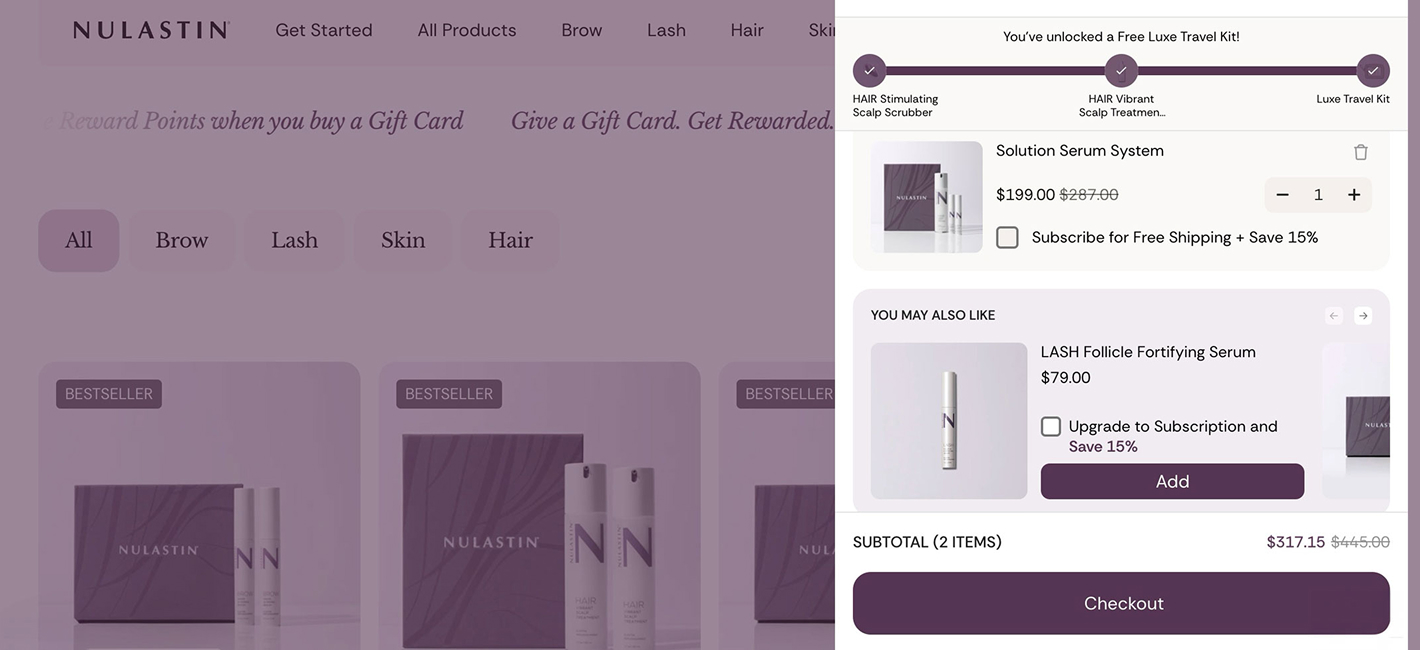
- Rebuy Slideout Cart
- Product Page Improvement
- Performance Optimization
- Affiliate Software Integration
- Bazaarvoice Reviews
Executive summary
and improve retention
Conversion Rate (CR)
Subscription Conversion
Business impact
After deploying the first subscription-focused experiment:
Scope of works will be delivered:
These gains reflected structural improvements to the subscription experience - not temporary conversion tactics with diminishing returns.
Optimization framework
Each experiment was designed and evaluated through an LTV-first lens.
First time subscription conversion
Add-to-Cart Rate (ATC)
Visitor intent: New vs Returning
Implementation was selective by design. Every deployed change met a clear threshold for sustained performance improvement.
Experiment breakdown
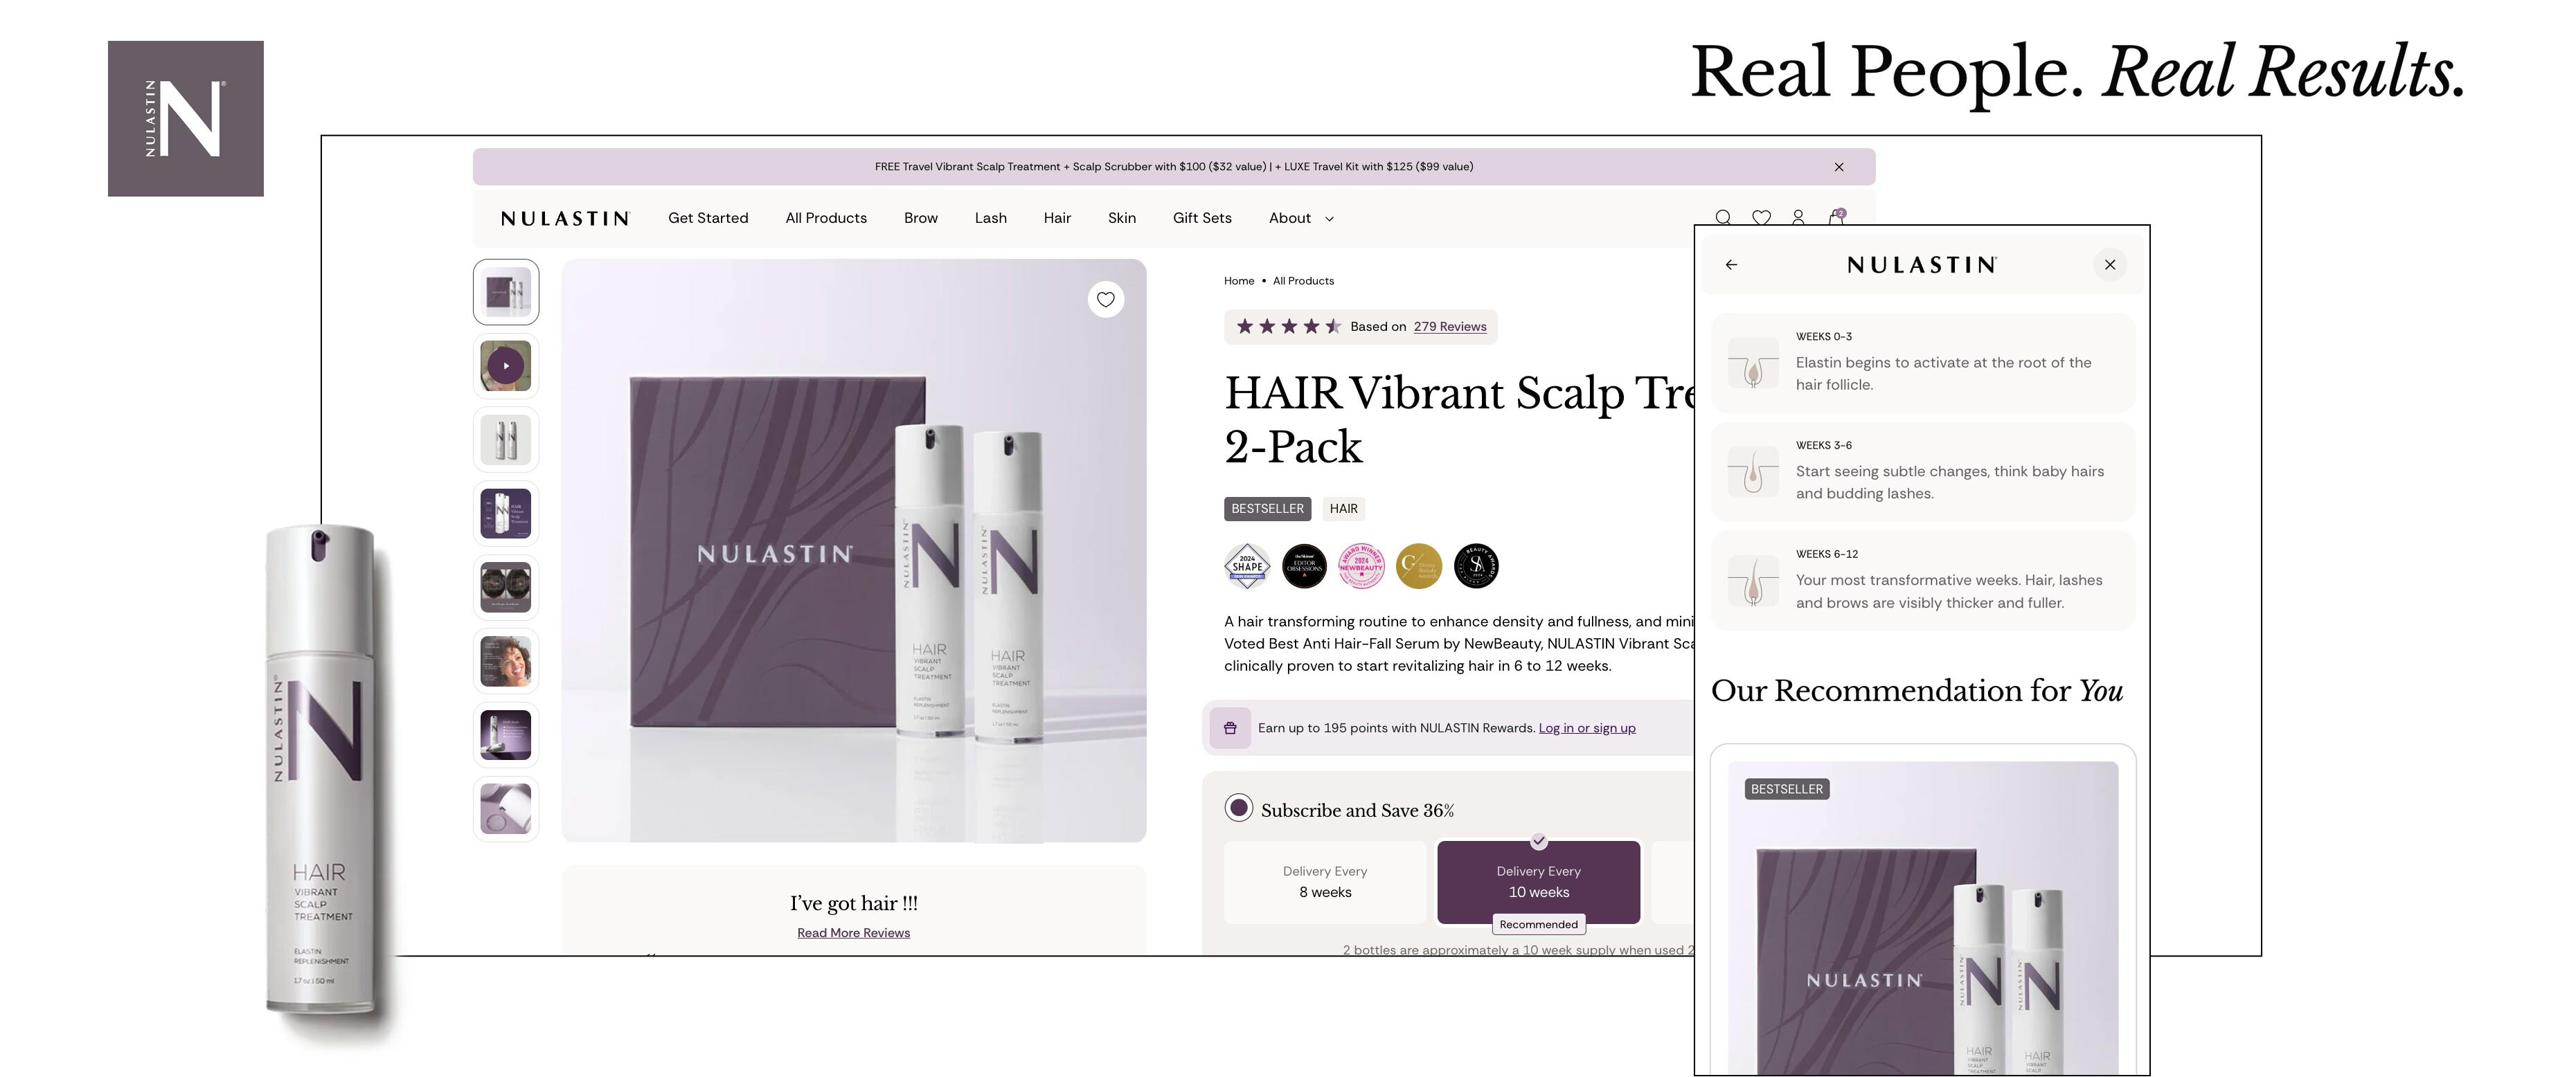
Quick View on Product Listing Pages (PLP)
- +8.3% increase in Revenue per Visitor
- Consistent performance across devices and visitor types
- No negative signals on subscription behavior
Accelerated Payments on Product Detail Pages (PDP)
- Overall impact was negative
- Returning mobile users: +31.4% CR, +37.3% RPV
- Strong lift in first-time subscription conversion (+108.3%)
Overall: -4.3% CR, -3.2% RPV
Subscription Upsell Modal on PDP
- Mixed impact on short-term revenue metrics
- Meaningful lift in first-time subscription conversion (+14.3%)
- No negative impact on churn indicators
Due to strong LTV signal 1st sub CR lift justifies flat RPV
PDP Experience Variant — Add to Cart CTA (Loss)
- Negative impact on leading indicators
- No segment demonstrated potential LTV upside
- Uniform underperformance across devices
Accelerated Payments in Quick View (PLP)
- Neutral overall impact
- Returning visitors showed improved subscription and RPV signals
- New visitors showed negative impact
Returning: positive sub signal
New visitors: negative
Reviews Placement Below Product Title
- Mixed performance by device
- Desktop: +27.2% CR, +22.3% RPV, +72.0% 1st Sub CR
- Mobile: slightly negative — excluded from rollout
Overall: +2.6% CR
Mobile: -0.5% CR (excluded)
Descriptive Add to Cart CTA Copy (PDP)
- +5.1% overall CR across all visitors
- +4.6% RPV with consistent performance on mobile and desktop
- Stable subscription performance — no negative signals on LTV
Mobile: +4.4% CR
Desktop: +8.6% CR
Mini-Cart Redesign for Improved Readability
- +3.3% overall CR, +1.4% RPV
- Desktop: +19.2% CR, +22.3% RPV, +23.8% 1st Sub CR
- Mobile: slightly negative — excluded from rollout
Overall: +3.3% CR
Mobile: -0.4% CR (excluded)
Descriptive Add to Cart CTA Copy — Quick View
- +9.7% overall CR — strongest clean win of the program
- +13.9% RPV across all segments and devices
- +13.9% 1st subscription CR with consistent performance
Desktop New: +25.2% CR
Desktop Ret: +25.1% CR
Mobile New: +6.7% CR
Pop-up on Award Icons (PDP)
- +5.9% overall CR, +7.6% RPV
- Positive performance across both devices and visitor types
- +4.0% 1st subscription CR — stable LTV signal
Mobile: +8.2% CR
Desktop: -0.9% CR
(offset by strong RPV +7.2%)
Revised PLP Layout on Desktop
- +35.0% desktop CR — largest single-segment win of the program
- +42.0% desktop RPV and +33.3% desktop 1st Sub CR
- Positive across all visitor types on desktop
Desktop only test. Overall CR lift driven
entirely by desktop segment
Key learnings
LTV-driven CRO requires
segment-level decision-making
Deploying globally on every winner would have harmed returning users in multiple tests. Segment-aware rollouts protected LTV while still capturing gains.
Returning users are the strongest
driver of long-term value
Returning visitors consistently outperformed new visitors on subscription and RPV metrics, particularly on accelerated payment tests.
Leading indicators must
be evaluated in context
RPV and 1st subscription CR sometimes moved in opposite directions. Evaluating both together — with LTV as the tiebreaker — led to better rollout decisions..
Selective rollouts protect both
revenue and customer experience
3 of 11 tests were partial rollouts. In each case, restricting deployment to the winning segment preserved overall performance while avoiding harm.
Descriptive copy
outperforms visual changes
Tests 7 and 9 (benefit-driven CTA copy on PDP and Quick View) were among the highest performers. Language that communicates value converts better than aesthetic changes.
Trust signals work
at the moment of intent
Tests 10 (award icon popups) and 6 (reviews near title) confirmed that surfacing credibility signals close to the purchase decision drives lift — especially on desktop.
These learnings compound when applied systematically. We help teams build a sequenced testing program that protects LTV while driving growth.
Real-world impact
Year-over-year comparison: Oct 2024–Mar 2025 (no CRO) vs Oct 2025–Mar 2026 (CRO active). Sessions were near-identical both periods, confirming that improvements reflect conversion quality — not traffic volume.
Conversion Rate & Revenue by Device:
Source: Triple Whale · Oct 2024–Mar 2025 vs Oct 2025–Mar 2026. Same seasonal window controls for Black Friday, Cyber Monday, and Christmas.
Consistent, compounding gains across mobile and desktop - driven by structured experimentation, not guesswork.
Final takeaway
For subscription businesses, CRO is not about optimizing a single metric.
It’s about designing experiences that increase customer lifetime value — and using metrics like Revenue per Visitor as early signals, not end goals. This segmented, LTV-first CRO approach delivered sustainable subscriber growth while minimizing risk across the funnel.
Over 11 sequential tests, each building on the last, the program delivered measurable site-wide improvement — validated by real year-over-year Triple Whale data showing +12.1% revenue growth and +17.6% conversion rate growth on near-identical traffic volumes.
We build CRO programs designed around lifetime value - structured, sequential, and measurable. If that aligns with where your business is headed, we should talk.
MAKE IT HAPPEN